
Country Profiles
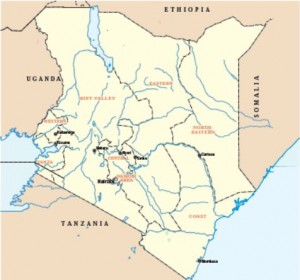 Table 75: KENYA QUICK
  FACTS
FACTS
President: Uhuru Kenyatta
Area: 580,367 sq. km
Capital: Nairobi (3.363 million inhabitants
– 2011)
Main Cities: Nairobi, Mombasa, Kisumu, Nakuru
Ports: Mombasa
GDP: US$79.9 billion (2013)
Population: 45 million (July 2014)
Language: English and Swahili (official)
Urban Population: 24% of total population (2011)
Rate of Urbanization: 4.36% annual change
Currency: Kenyan Shilling (KES)
Climate: Varies from tropical along the
coast to arid in the interior
ECONOMIC BRIEF
Kenya’s economy continued to recover in 2013 from the slowdown experienced in 2011. Real GDP growth accelerated to 5.2%, 4.3% and 4.6% in the first three quarters of 2013 primarily driven by financial intermediation, tourism, construction and agriculture.
Real GDP growth is estimated at 5.7% in 2014 respectively. Similarly CPI inflation is expected to remain single digit over the same period. The economy’s short- to medium-term forecast is for sustained and rising growth based on: increased investor and business confidence in the wake of peaceful March 2013 elections, increased rainfall, a stable macroeconomic environment, lower, stable international oil prices, stability of the Kenya shilling, and reforms affecting security, governance and justice.
However, Kenya has been hampered by recent terrorist attacks and by reliance upon exporting several primary goods whose prices have remained low. Low infrastructure investment threatens Kenya’s long-term position as the largest East African economy, although the Kenyatta Administration has prioritized infrastructure development. International financial lenders and donors remain important to Kenya’s economic growth and development. Unemployment is high at around 40% and more than 60% of the population is under 24 years of age.
Kenya is integrated into a number of global value chains – e.g. floriculture, textiles, leather, manufacturing and tourism – but economic and social benefits have been limited due to insufficient or unsustainable linkages with other sectors.
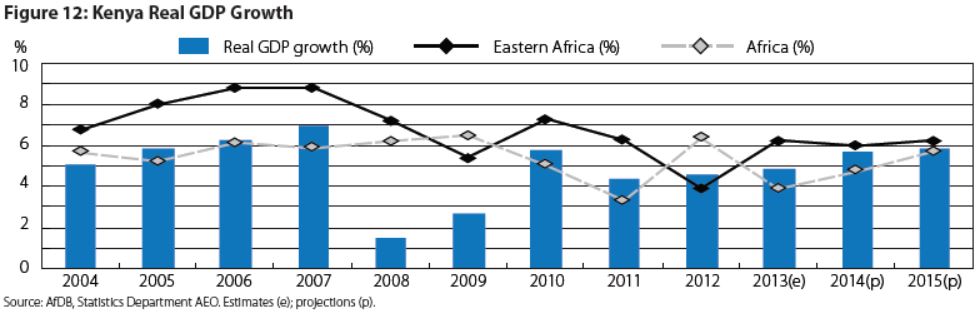
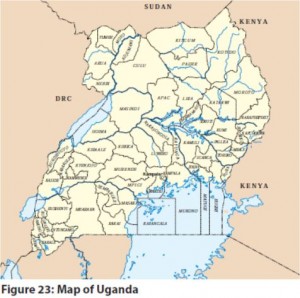 Table 163: UGANDA
 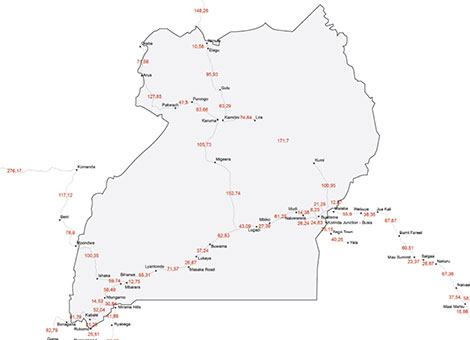 QUICK FACTS
President:
Lt. Gen. Yoweri Kaguta Museveni
Area:
241,038 sq. km
Capital:
Kampala (1.659 million inhabitants – 2011)
Main Cities:
Kampala, Gulu, Lira, Mbarara, Jinja, Bwizibwera, Mbale, Mukono, Kasese, Masaka
Ports:
Bell (on Lake Victoria)
GDP:
US$54.37 billion (2013)
Population:
35.9 million (July 2014)
Language:
English (official)
Urban Population:
15.6% of total population (2011)
Rate of Urbanization:
5.74% annual change
Currency:
Ugandan Shilling (UGX)
Climate:
Tropical climate, semiarid in northeast
ECONOMIC BRIEF
Uganda has substantial natural resources, including fertile soils, regular rainfall, small deposits of copper, gold, and other minerals, and recently discovered oil. Uganda has never conducted a national minerals survey. Agriculture is the most important sector of the economy, employing over 80% of the work force. Coffee accounts for the bulk of export revenues.
In 2013, Uganda saw the consolidation of macroeconomic stability and a gradual recovery of economic activity, with estimates putting annual real gross domestic product (GDP) growth at 5.2%, up from 2.8% in 2012. This recovery in economic activity has benefited from a fiscal and monetary policy stance focused on containing inflationary pressures, while ensuring debt and exchange rate stability, thus providing an enabling macroeconomic environment for growth. Medium-term forecasts indicate a consolidation of these trends with GDP growth reaching 6.6% in 2014 and 7% in 2015, and improvement of the current account balance and a mildly expansionary fiscal policy.
Value chain development is receiving increasing attention in Uganda, as a way of developing production capacities and enhancing value added generation in primary sectors. While Uganda has been relatively successful in tapping into a number of global value chains, such as those for fish, floricultural and horticultural products, growth prospects in these and other key product chains face a number of constraints. These consist of high production costs, including transport and energy costs, as well as weak product-specific policy and institutional frameworks that prevent the provision of adequate support to the development of selected value chains.
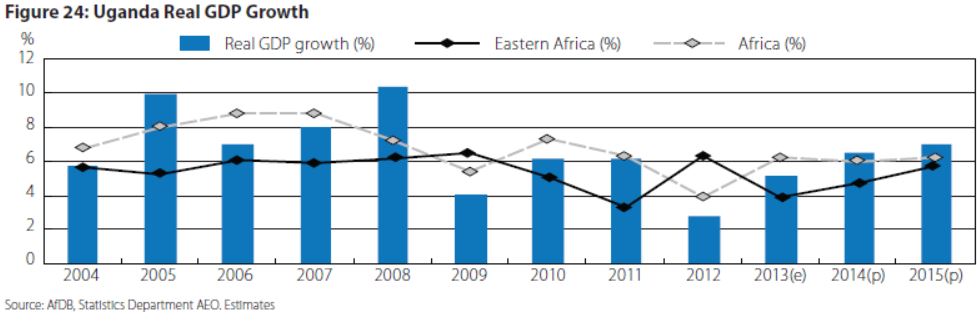
Table 90: RWANDA QUICK 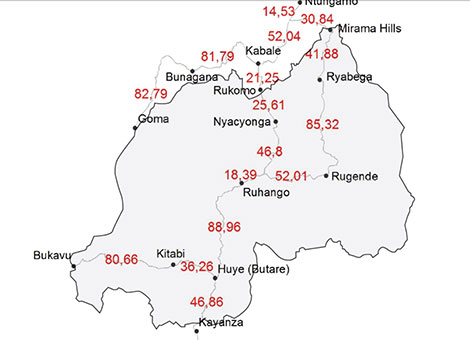 FACTS
FACTS
President:
Paul Kagame
Area:
26, 338 sq. km
Capital:
Kigali (1.004 million inhabitants – 2011)
Main Cities:
Kigali, Butare
GDP:
US$16.37 billion (2013)
Population:
12.34 million (July 2014)
Language:
English, Kinyarwanda, French, Swahili (official)
Urban Population:
19.1% of total population (2011)
Rate of Urbanization:
4.5% annual change
Currency:
Rwandan Franc (RWF)
Climate:
Temperate; mild in mountains with frost and snow possible
ECONOMIC BRIEF
Africa’s most densely populated country is trying to overcome the limitations of its small, landlocked economy by leveraging regional trade. Rwanda joined the East African Community (EAC) and is aligning its budget, trade, and immigration policies with its regional partners. With a predominantly rural population, 90% of whom are engaged in (mainly subsistence) agriculture (and some mineral and agro-processing), the Rwandan government has embraced an expansionary fiscal policy to reduce poverty by improving education, infrastructure, and foreign and domestic investment and pursuing market-orientated reforms.
Real GDP growth slowed in 2013 in part due to poor performance in agriculture and the lagged effects of the suspension of budget support disbursements in 2012. Estimates indicate that industry and services were the primary drivers of growth in 2013, while growth in agriculture, though modest, was stronger compared to 2012. Export earnings increased by an estimated 33% in 2013, compared to the previous year, on the back of increased coffee and tea production and favorable prices for key mineral exports, particularly coltan and cassiterite. GDP growth is projected to have increased from 4.6% in 2013 to 7% in 2014. The key growth drivers in the short and medium term include recovery in the services sector, increased productivity in the agriculture sector and the sustained implementation of the public investment program.
Tourism, minerals, coffee and tea remain Rwanda’s main sources of foreign exchange, although the Rwandan Government aspires to have the country become a regional leader in information and communication technologies. Rwanda completed its first modern Special Economic Zone (SEZ) in Kigali, and seeks to attract investment in agribusiness, information and communications technologies, trade and logistics, mining, and construction. However, energy shortages, instability in neighboring states, and the lack of adequate transportation linkages to other countries continue to handicap private sector growth.
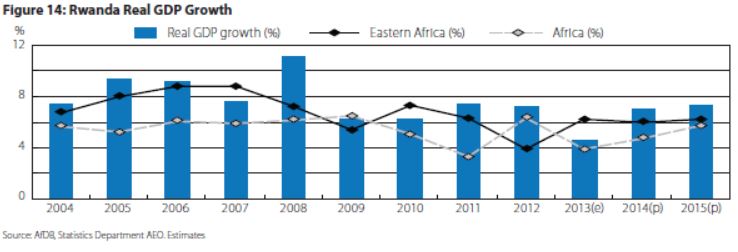
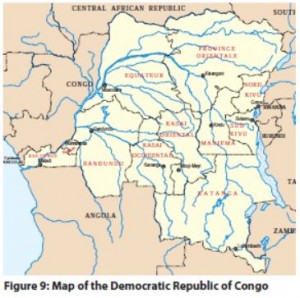 Table 60: DRC QUICK
  FACTS
FACTS
President:
Felix Tshisekedi
Area:
2,344,858 sq. km
Capital:
Kinshasa (8.8 million inhabitants – 2011)
Main Cities:
Kinshasa, Lubumbashi, Mbuji-Mayi, Kananga, Kisangani, Bukavu, Goma
Ports:
Port Matadi
GDP:
US$29.39 billion (2013)
Population:
77.43 million (July 2014)
Language:
French (official)
Urban Population:
34.3% of total population (2011)
Rate of Urbanization:
4.19% annual change
Currency:
Congolese Franc
Climate:
Tropical climate, hot and humid, cooler and drier in Southern highlands, wetter in eastern highlands
ECONOMIC BRIEF
The economy of the Democratic Republic of the Congo – a nation endowed with vast natural resource wealth – is slowly recovering after decades of decline. The economy remained strong in 2013 with growth in gross domestic product (GDP) of 8.1% (against 7.2% in 2012), thanks to mining, trade, construction and agriculture. Growth has benefited from the improvement in some aspects of the business environment, the reconstruction of infrastructure and strong demand. Mining has been the main driver of growth, and several mining companies have developed from exploration to production since 2013.
Systemic corruption since independence in 1960, combined with countrywide instability and conflict that began in the mid-90s has dramatically reduced national output and government revenue and increased external debt. An uncertain legal framework, corruption, and lack of transparency in government policy are long-term problems for the mining sector and for the economy as a whole. Much economic activity still occurs in the informal sector and is not reflected in GDP data.
With the installation of a transitional government in 2003 after peace accords, economic conditions slowly began to improve as the transitional government reopened relations with international financial institutions and international donors, and President Kabila began implementing reforms. Progress has been slow to reach the interior of the country although clear changes are evident in Kinshasa and Lubumbashi. In 2012, the DRC updated its business laws by adhering to OHADA, the Organization for the Harmonization of Business Law in Africa. The country marked its 10th consecutive year of positive economic expansion in 2012.
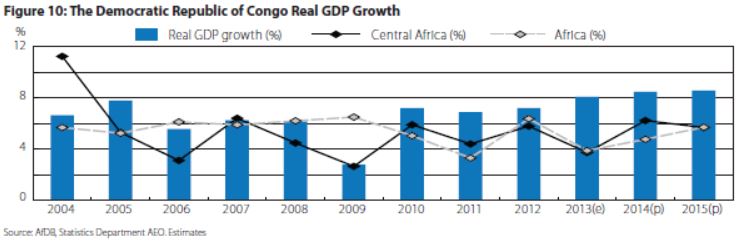
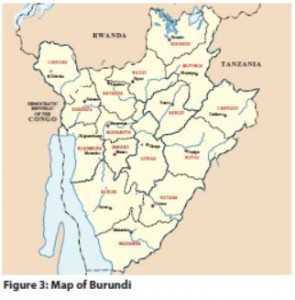 Table 17: BURUNDI QUICK
 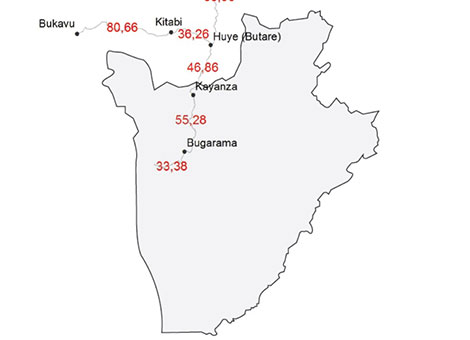 FACTS
FACTS
President:
Pierre Nkurunziza
Area:
27,830 sq. km.
Capital:
Bujumbura (605,000 inhabitants – 2011)
Main Cities:
Bujumbura
Ports:
Port Bujumbura
GDP:
US$5.75 billion (2013)
Population:
10.4 million (July 2014)
Language:
French (official)
Urban Population:
10.9% of total population (2011);
Rate of Urbanization:
4.12% annual change
Currency:
Burundian Franc
Climate:
Equatoria
ECONOMIC BRIEF
Burundi is a landlocked, resource-poor country with an underdeveloped manufacturing sector. The economy is predominately agricultural. Agriculture accounts for just over 30% of GDP and employs more than 90% of the population. Burundi’s primary exports are coffee and tea, which accounts for 90% of the foreign exchange earnings, though exports are a relatively small share of GDP. Burundi’s export earnings – and its ability to pay for imports – rests primarily on weather conditions and international coffee and tea prices.
A series of exogenous shocks (a rise in world oil and food prices and a decline in revenue) struck economic activity in 2013. Growth in GDP accelerated slightly from 4.2% in 2012 to 4.6% in 2013, inflation dropped from 18.2% to 7.8%, the fiscal deficit narrowed from 9.1% to 2% and the Burundian Franc (BIF) depreciated by 5% against the US dollar (USD) from January to December.
The primary sector contracted by 2% in 2013, mainly due to the effects of rainfall on coffee production. The economy has slowly recovered over the past two years as services and the secondary sectors have expanded, the latter having benefited from investment in industry, construction and public works.
Despite the tough economic climate, Burundi’s economic policy aims to provide the country with the necessary infrastructure and promote rapid, sustained growth in line with the strategic framework for growth and poverty reduction (Cadre stratégique de croissance et de lutte contre la pauvreté, CSLP II) adopted in February 2012. Major energy, transport, water, electricity and telecommunications projects began in 2013, and new programs were presented to technical and financial partners at industry conferences in July and October 2013.
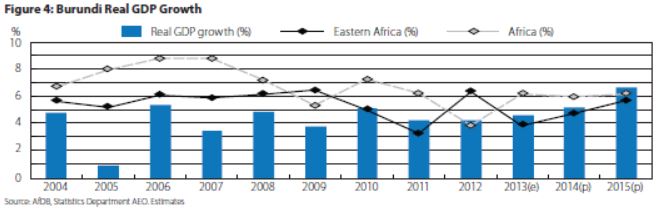
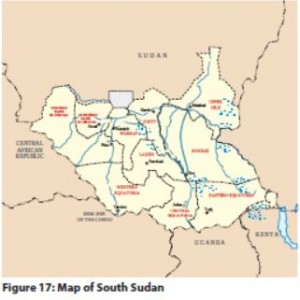 Table 119: SOUTH SUDAN
 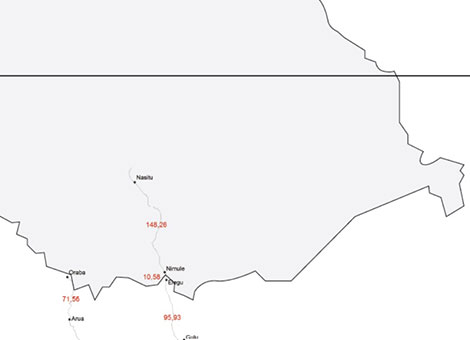 QUICK FACTS
President:
Salva Kiir Mayardit
Area:
644,329 sq. km
Capital:
Juba (269,000 inhabitants – 2011)
Main Cities:
Juba
GDP:
US$14.71 billion (2013)
Population:
11.56 million (July 2014)
Language:
English, Arabic, Dinka, Nuer, Bari, Zande, Shilluk (official)
Urban Population:
18% of total population (2011)
Rate of Urbanization:
4.23% annual change
Currency:
South Sudanese Pound (SSP)
Climate:
Hot with seasonal rainfall
ECONOMIC BRIEF
At independence in 2011, South Sudan produced nearly three-fourths of former Sudan’s total oil output of nearly a half million barrels per day, however, subsistence agriculture provides a living for the vast majority of the population. The Government of South Sudan derives 98% of its budget revenues from oil. Oil is exported through two pipelines that run to refineries and ship facilities at Port Sudan on the Red Sea. The outbreak of conflict on 15 December 2013 combined with a further reduction of oil exports, means that GDP growth forecasts for 2014 are being revised downwards again, and poverty and food insecurity are rising.
South Sudan holds one of the richest agriculture areas in Africa with fertile soils and abundant water supplies. Currently the region supports 10 million head of cattle. Growing infrastructure projects and business facilities in South Sudan are driving demand for construction materials; imports are estimated at US$3.4 million and growing. Due to the distance and poor infrastructure, supply of materials from neighboring countries is costly, even as South Sudan’s rich deposits of limestone, sand, and other critical raw materials could support a boom in construction materials production in support of construction demand in the coming years.
South Sudan has received more than $4 billion in foreign aid since 2005, largely from the UK, the US, Norway, and the Netherlands. Following independence, South Sudan’s Central Bank issued a new currency, the South Sudanese Pound, allowing a short grace period for turning in the old currency. Annual inflation peaked at 79.5% in May 2012, but declined rapidly thereafter, to an average of 1.7% in 2013. Following the December 2013 outbreak of violence, inflation is on the rise again. Long-term challenges include diversifying the formal economy, alleviating poverty, maintaining macroeconomic stability, improving tax collection, financial management, and improving the business environment.
Table 124: SOUTH SUDAN SELECTED INVESTMENT PRIORITIES
The South Sudan’s Government Investment Strategy is aligned to the following designated priority sectors/ industries for investment:
• Agriculture and Agri-business
• Forestry
• Water
• Physical Infrastructure and Social Infrastructure
• Mining, Quarrying, Energy and Electricity, Petroleum, and Gas Industries
• Research on mapping of natural resources for economic use
• Manufacturing
• Transport
• ICT
• Print and Electronic Media
• Commercial Banking and Insurance
• Property Management and Financial Institutions
• Hospitality and Tourism
• Social Housing, Education and Health
• Pharmaceuticals, Chemicals, Medical and Surgical
Table 120: SOUTH SUDAN KEY INDUSTRIES
Agriculture
Sorghum, maize, rice, millet, wheat, gum arabic, sugarcane, mangoes, papayas, bananas, sweet potatoes, sunflower seeds, shea nut trees, cotton, sesame seeds, cassava, beans, peanuts; cattle, sheep
Industries
Petroleum, mining, forestry, gum Arabic, hides and skins
Table 121: SOUTH SUDAN NATURAL RESOURCES
• Hydropower• Fertile agricultural land• Gold• Diamonds• Petroleum• Hardwoods• Limestone• Iron ore• Copper• Chromium ore• Zinc• Tungsten• Mica• Silver
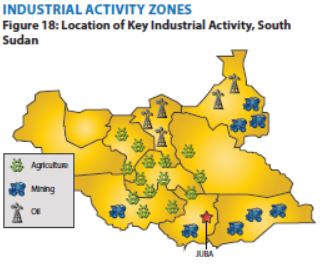
Table 122: SOUTH SUDAN TRADE
Exports
$4 billion (2013)
Commodities
Oil (90%)
Partners
China 72%, Japan 21%, USA 6%
Imports
$262 million (2010)
$138 million (2006)
Partners
China 25%, USA 23.2%, Pakistan 22.3%, Uganda 13.3%
Table 123: SOUTH SUDAN FOREIGN DIRECT INVESTMENT
There are no current statistics on South Sudan’s foreign direct investment to date. However, generally, China remains a major investor in the oil sector and investors from Kenya, Uganda, and Ethiopia have been key investors in the construction, hospitality, and agriculture/ agribusiness sectors over the past three years.
Table 126: SOUTH SUDAN MEMBERSHIP IN REGIONAL ECONOMIC COMMUNITY (IES)
• COMESA – Common Market of Eastern and Southern Africa
• EAC – East African Community (Applied, in negotiations)
• Tripartite FTA (Free Trade Agreement) – SADC, EAC (East African Community) and COMESA (Common Market for Eastern and Southern Africa)
Table 127: ACTIVE DEVELOPMENT PARTNERS IN SOUTH SUDAN
• African Development Bank (AfDB)
• Canadian International Development Agency (CIDA)
• International Fund for Agricultural Development (IFAD)
• US Agency for International Development (USAID)
• World Bank (WB)
• UN System (UN)
Table 128: NGOS/ CHARITABLE INITIATIVES IN SOUTH SUDAN
• Association for Strengthening Agricultural Research in Eastern and Central Africa (ASARECA)
• Catholic Organization for Relief and Development AID (CORDAID)
• Institute for Security Studies Africa (ISSAFRICA)
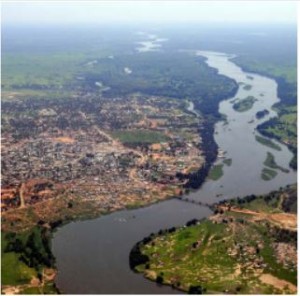
Table 125: SOUTH SUDAN INVESTMENT INCENTIVES
• Access to Land: RSS and/or the Local Authorities shall provide land. Investments in agriculture, plantation forestry, quarrying, and mining shall be deemed to be included in the priority and strategic sectors subject to legal limits on concession periods and renewal requisites.
• Licenses: An Investment Certificate issued by the Investment Authority entitles the investor to invest in the priority area of choice.
• Entry/Work Permits: An Investment Certificate entitles the investor to entry/work permits for their designated managers. The first permits will be issued free of charge and are valid for two years.
• Duty Exemptions: Agricultural imports, tools, equipment, machinery and tractors, pharmaceutical, animal feeds, seeds for boosting food, and cash crops production shall be exempt from any duties and taxes for a period that shall be determined by the law.
• Tax Incentives: Incentives include capital allowances ranging from 20-100%; deductible annual allowances ranging from 20-40%; and other depreciation allowances ranging from 8-20%.
• Special Incentives: Special incentives may be granted by the board of investments in strategic or transformational sectors. These special incentives are only available on special applications by investments in areas designated as strategic or transformational.
Investment Guarantees, Benefits and Incentives:
• Non-Discrimination Access to Land
• Guarantees against Expropriation
• Licenses
• Protection of Intellectual Property Rights
• Entry/Work Permits
• Access to Public Information
• Duty Exemptions
• Repatriation of Capital
• Profits and Dividends
• Tax Incentives
• Dispute Resolution Special Incentives
Table 129: SOUTH SUDAN SELECTED PEACE DIVIDEND PROJECTS
See – http://www.investsouthsudan.org/presentations.aspx for full project briefs:
I. Lakki Hydro Plant – hydropower scheme to address chronic electricity shortages
II. Kapoeta Cement Factory – building materials manufacturing plant to meet rising demand
III. Aweil Rice Scheme – rice farming program to improve national food security
IV. Marial-Bai Livestock Improvement Centre – livestock farming scheme to leverage abundance of livestock for domestic and regional food security
V. Yirol Oil Mill and Nucleus Farm – oilseed processing facility to supply domestic and regional market
VI. Nzara Agro-Industrial Complex – multifaceted agro-industrial farm to supply Southwestern area of country and the DRC and CAR with a number of products,
Table 130: SOUTH SUDAN’S UNEMPLOYMENT
• 35%
Table 131: SOUTH SUDAN’S GLOBAL VALUE CHAIN LINKAGES
• Oil
• Potential:
– Mining
– Agriculture
– Forestry
– Livestock
– Gum Arabic
Table 132: SOUTH SUDAN REFERENCES AND RESOURCES
a. African Economic Outlook –
www.africaneconomicoutlook.org/en
b. AFDB, OECD, UNDP – www.afdb.org
c. CIA Factbook – www.cia.gov/library/publications/the-world-factbook
d. Humanitarian Practice Network, Issue 57, May 2013: Lesson on Transition in South Sudan by George Conway- http://www.odihpn.org/humanitarian-exchange-magazine/issue-57/lessons-on-transition-in-south-sudan
Information sourced from: “INVESTING IN THE GREAT LAKES REGION: AN INVESTMENT OPPORTUNITIES BRIEF (IOB) Volume 2 Country Profiles of the Expanded Great Lakes Region: The 13 Peace, Security and Cooperation Framework Signatories”